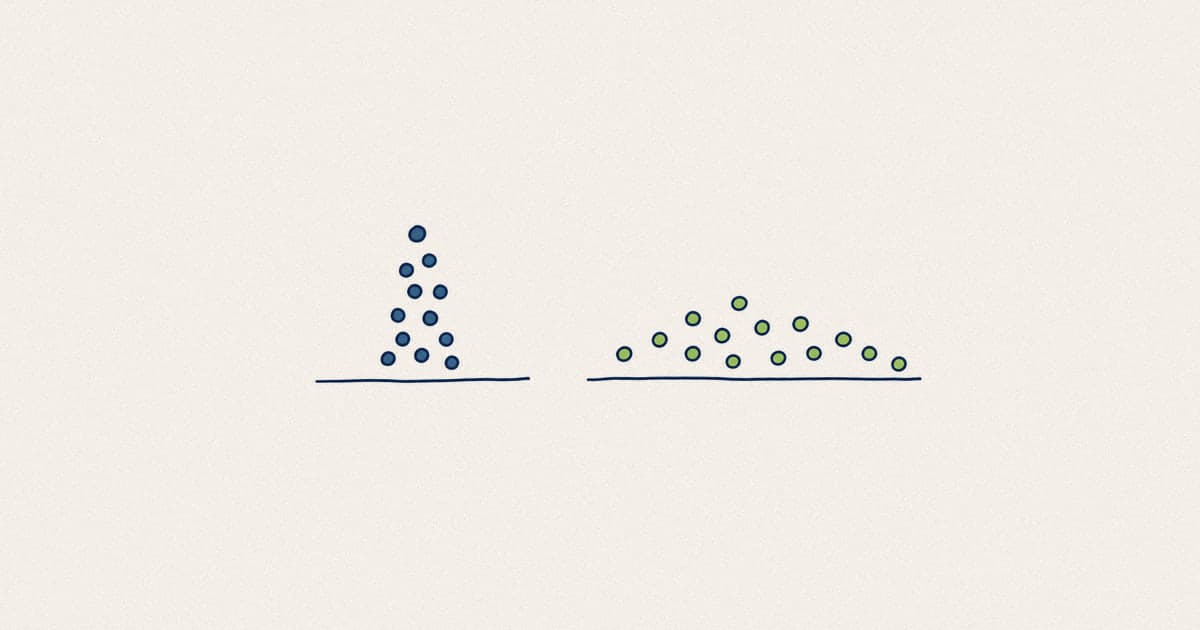
Most turnover rates we get shown are wrong by a factor that changes the conclusion. The error is almost always in the denominator.
The formula
Average headcount is (headcount at start + headcount at end) ÷ 2, not the
December 31 figure. A company that grows from 80 to 120 employees over the year
with 20 departures has a rate of 20%, not 16.7%.
What counts as a departure
Any permanent exit from payroll: resignation, termination, end of contract, retirement, death. Parental leave, disability leave and internal transfers do not.
Average headcount, the exact version
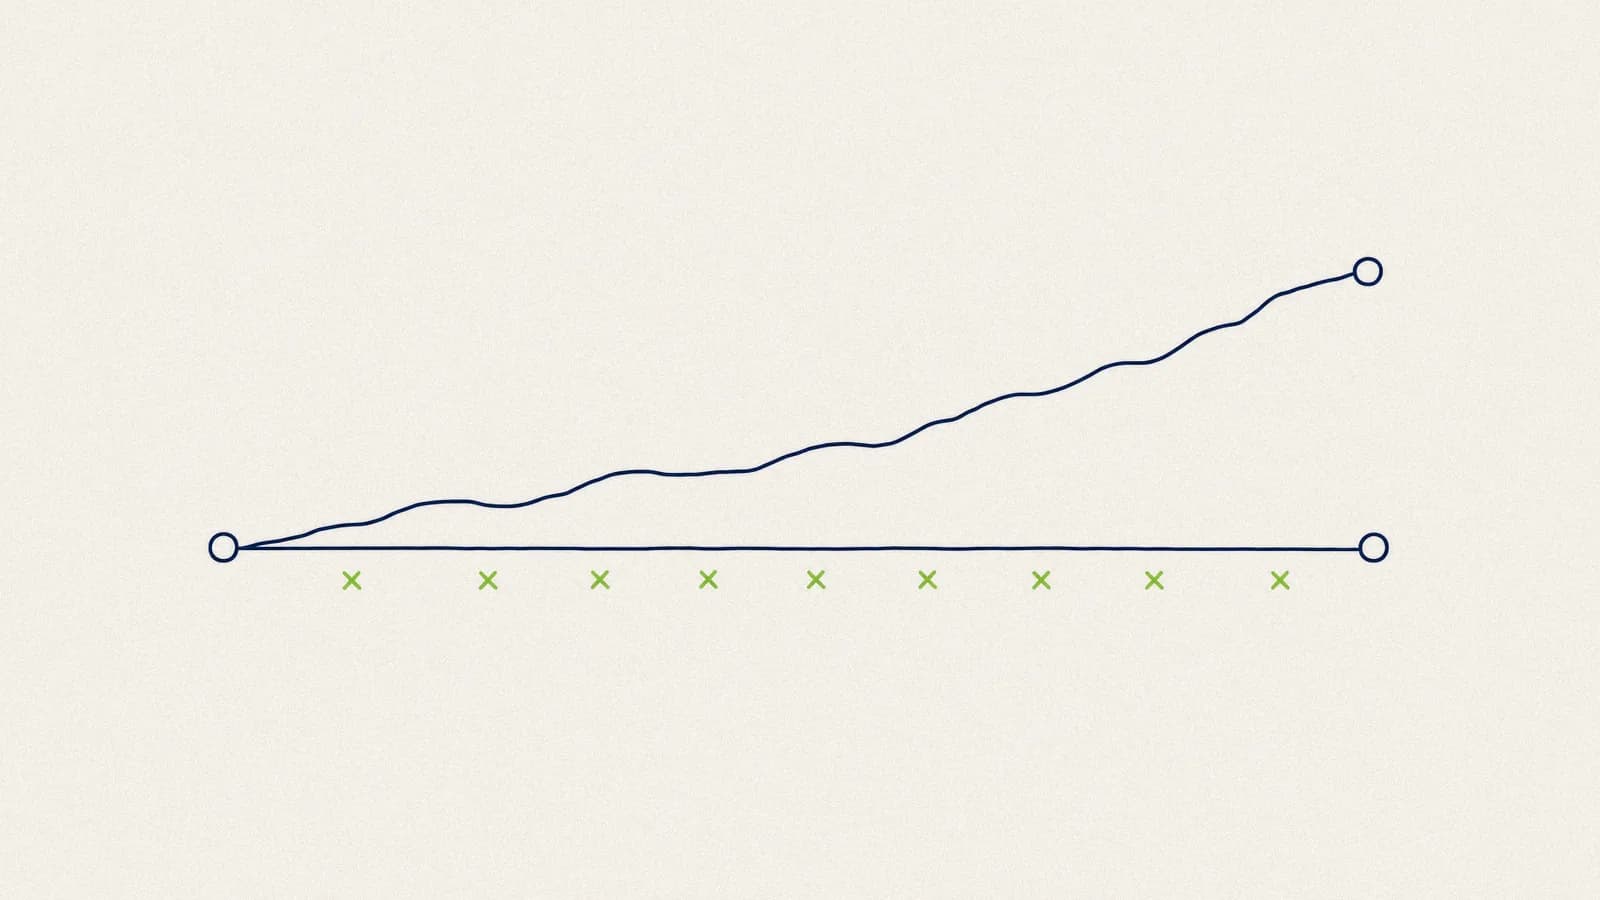
Averaging the two endpoints is fine when growth is steady. It lies the moment the year isn't. Take a seasonal business that opens the year at 100 people, climbs to 180 in July and drops back to 100 by December: the two-endpoint average says 100, and its real denominator is closer to 130.
The exact version: add up the month-end headcount and divide by twelve. If your headcount swings more than 15% within the year, don't take the shortcut.
Separate voluntary from the rest
A blended rate is useless. Three companies at 18% can be living three very different situations.
The voluntary rate measures organizational health. The rest measures your decisions.
One full calculation
Here's the whole exercise on a 140-person services company. Headcount last December 31 was 128, this year it closes at 152. The sum of the twelve monthly readings divided by twelve gives 141: neither 128, nor 152, nor 140.
Twenty-six people left. Strip out what isn't a departure: two parental leaves and one transfer to the Ontario subsidiary. That leaves 23 real departures.
A 16.3% blended rate in services isn't dramatic. But nine of the twenty-three departures are people who'd been there under a year: 39% of all turnover happens in year one. The problem is hiring, onboarding or the gap between what was promised at interview and what exists. Without that row, this company launches a recognition programme and fixes nothing.
The turnover rate calculator runs these four lines, monthly average included.
First-year turnover
It's the highest-yield split available, and almost nobody runs it. Someone leaving after eight months and someone leaving after eleven years don't share a cause, a cost or a fix.
Calculate it against the same denominator as your headline rate, counting only people who left before their first anniversary. Above 20%, the problem sits upstream: your selection process, your job description or the first week.
Turnover and retention are not two halves of 100
A classic trap: "we're at 85% retention, so 15% turnover." The two measures don't count the same population. A company that hires 30 people in January and loses 25 of them in October posts excellent retention alongside catastrophic turnover. Present turnover: it sees the revolving door that retention misses.
The traps
Before presenting the number
- Average headcount, not end-of-period headcount.
- Twelve monthly readings if headcount swings more than 15% in the year.
- Voluntary departures isolated from the total.
- Sub-12-month departures counted separately.
- Seasonal roles excluded or calculated separately.
- The same definition year over year or the trend means nothing.

What the number does not tell you
A turnover rate is a symptom, not a diagnosis: it tells you something is happening, never what. Cross three things: average tenure before departure, the reporting manager and what the exit interviews say.
The second is the most useful. Recalculate the rate by reporting manager, over 24 months so small teams mean anything at all. Almost everywhere, one or two teams carry a share of the turnover wildly out of proportion to their share of headcount.
A rate climbing from 12% to 19% in one year inside a single team is not an HR problem. It is a management problem, and it has a name.
What to do with the number
An indicator that triggers no action is decorative. Set the thresholds in advance, before anyone is being defensive.
Before you argue over a budget, work out what turnover costs you. The cost-of-departure calculator converts the percentage into dollars, and that's when finance starts listening.
The number tells you there is a problem, never which one. That is what an organizational diagnostic goes after, in three weeks of interviews and real data.